

1. Introduction
2. Materials and Methods
2.1 Field Survey
2.2 Sample analysis
2.3 Data analysis
3. Results
3.1 Spatial distribution of environmental variables
3.2 Spatial distribution of phytoplankton
3.3 Relationship between the environment variables and major phytoplankton groups
4. Discussion
4.1 Environmental conditions and phytoplankton community distribution in Gamak Bay
4.2 Positive correlation of diatoms with DIP
4.3 Positive correlation of dinoflagellates with autotrophic cyanobacteria
4.4 Further directions
1. Introduction
Phytoplankton play an important role as main primary producers in marine ecosystems, phytoplankton is particularly responsible for 50% of primary production around the world (Cloern et al. 2014). In coastal waters, phytoplankton thrive in the estuarine-coastal continuum, where phytoplankton are influenced by anthropogenically-driven nutrients (Arndt et al. 2011; Kennish 2001; Pastorok and Bilyard 1985). The excessive nutrient loading often causes eutrophication in the coastal waters and phytoplankton have a full access to utilize the enriched nutrients (James 2001). River discharge (Kang et al. 2020b) and fertilizer (Davidson et al. 2014; Gobler et al. 2013) often control phytoplankton bloom dynamics while sewer pipes directly import nutrients to the coastal ecosystems (Jeong et al. 2019). Anthropogenic activities drive a nitrogen increase in the estuarine-coastal continuum, and particularly, a gradual increase in NH4+ declines phytoplankton biomass in the anthropogenically complex estuarine ecosystem (Kang et al. 2020b). In addition, a sufficient amount of phosphate is regeneralized from organic matter buried in the surface sediments, supplying phosphate to phytoplankton in the water columns (Nowicki and Nixon 1985).
The importance of nitrogen in phytoplankton bloom dynamics has gained much attention in coastal waters of Korea (Kang and Kang 2022; Kang et al. 2020b). Nitrogen, phosphate, and silicate are considered as the limiting nutrients in the phytoplankton growth (Karl 2000; Paytan and McLaughlin 2007), whereas the role of phosphate has not been much investigated. Phosphate is essential to all organisms including phytoplankton because phosphate is a major component of phosphate-ester backbone of DNA and RNA and importantly acts in transmitting chemical energy (Paytan and McLaughlin 2007). Phosphate limitation reduces phytoplankton biomass (Lin et al. 2005) and phosphate deficiency decreases diatom dominance (Egge 1998).
While phosphate largely affects phytoplankton bloom dynamics as described above, the nutritional acquisition modes in dinoflagellates are various, including autotrophy, heterotrophy, mixotrophy (Jeong et al. 2021b; Kang et al. 2020a). Mixotrophs has photosynthesis and feeding mechanism simultaneously (Aishao et al. 1999; Burkholder et al. 2008), mixotrophic dinoflagellates can feed on the various size of plankton including picoplankton (Jeong et al. 2005), and the ingestion rates are typically governed by the prey size (Jeong et al. 2010). Although the various acquisition modes enable dinoflagellates to dominate from the nutrient poor open ocean to the nutrient-enriched eutrophic waters (Sanders et al. 1990), the distribution of mixotrophs regarding the distribution of potential prey has not been much investigated in Korean coastal waters.
Gamak Bay is located in the southwestern coastal waters of Korea, and is characterized by archipelago coastal lines. This bay has a length of 15 km and area of 112 km2, in which five stations are designated as a regular monitoring sites by the National Institute of Fisheries Science. In the bay, shellfish farms are located in the inner bay and fish farms are located in the outer bay, while the oyster production from Gamak Bay is responsible for 30 % of the domestic shellfish consumption (Lee et al. 2020). In this bay, phytoplankton studies have been performed regarding the spatial and temporal variations in environmental conditions. Phytoplankton communities were quantified using a microscopy (Oh et al. 2009; Park et al. 2009) and a high-performance liquid chromatograph with CHEMTAX (Lee et al. 2011), with focus on diatoms and dinoflagellates, associated with the spatial and temporal variation in physicochemical properties.
In Gamak Bay, a large amount of phosphate is regenerated from the surface sediments in the hypoxic environments, causing to eutrophication (Jeong et al. 2021a; Jeong et al. 2019; Kim et al. 2011). In addition, our previous study showed that the abundance of picoplankton and nanoplantkon are not negligible throughout the bay (unpublished data). Thus, we hypothesized that different types of nutrient sources such as dissolved inorganic nutrients and organic source (e.g. prey for feeding organisms) control the distribution of phytoplankton community in Gamak Bay. Here, we quantified phytoplankton community throughout the bay. Microplankton including diatoms and dinoflagellates were quantified using a microscopy while picoplankton (e.g. phycocyanin-containing (PC) cyanobacteria, phycoerythrin-containing (PE) cyanobacteria) were quantified using a flow cytometer. Size-fractionated chlorophyll a (Chl. a) was measured to assess responses of size-dependent phytoplankton to environmental variables, particularly, associated with phosphate and picoplankton. For statistical analyses, the principal component analysis was performed to examine the contribution of major variables to the Gamak Bay ecosystem, and the correlation analysis and regression analysis were conducted to exhibit the relationship between environmental variables and major phytoplankton groups.
2. Materials and Methods
2.1 Field Survey
Samples were collected at five stations throughout Gamak Bay in the southern coastal waters of Korea on November 5, 2021, during a cruise with R/V Cheongkyung using a Niskin water sampler (General Oceanics, Miami, FL, USA) from 1 m below the surface (Fig. 1). Samples for Chl a, flow cytometry, dissolved inorganic nutrient (NO3-, NO2-, NH4+, PO43-, Si(OH)4), and phytoplankton samples were generated on board. Temperature, salinity, dissolved oxygen (DO), and pH were measured on the surface water using a YSI ProDSS (YSI Inc., Yellow Springs, OH, USA). Transparency was measured using a secchi disk. For total Chl a, the collected seawater was filtered onto GF/F (47 mm in diameter; Whatman plc, Maidstone, UK) and the size-fractionated chl. a samples were generated by sequentially filtering onto polycarbonate filters with different pore sizes (0.2 µm, 2 µm, 20 µm polycarbonate track etched membrane filter 47 mm diameter; GVS North America, ME, USA). Flow cytometric samples were prepared by adding 0.5 mL of 10% buffered formalin into 4.5 mL of seawater and stored at ‒80ºC until analysis. 20 mL of seawater were filtered onto pre-combusted GF/F filters (25 mm, 450°C for 2 h) to produce dissolved inorganic nitrogen samples and stored at ‒80°C until analysis. One L seawater was collected in the surface for phytoplankton quantification and then fixed with the Lugol’s solution and stored at 15~25℃ after wrapped with aluminium foil to block light until the sample analysis. Phytoplankton samples were settled for at least 48 h to concentrate, and a final volume of 30 mL were generated in centrifugal tubes.

2.2 Sample analysis
Filtered samples for size-fractionated Chl a were added with 5 mL of 90% acetone and Chl a was extracted for 24 h at ‒80°C. Then, Chl a was measured using a fluorometer (TrilogyTM fluorometer; Turner Designs, Sunnyvale, CA, USA). Phytoplankton size was defined as picoplankton < 2 µm, nanoplankton 2‒20 µm, and microplankton > 20 µm. Picoplankton were quantified according to Kang and Oh (2021), using a flow cytometer at the Chonnam National University in Yeosu, South Korea. Eukaryotes (> 2 µm), phycocyanin-containing cyanobacteria (PC cyanobacteria), phycoerythrin-containing cyanobacteria (PE cyanobacteria) that PC cyanobacteria and PE cyanobacteria is combined autotrophic bacteria (Autotrophic bacteria) were identified. Qualitative analysis were performed with an inverted Zeiss Winkel microscope by the Utermöhl technique (1958), in chambers of 30 mL volume. Species identification refers to the Illustrated encyclopedia of fauna & flora of Korea vol.34 marine phytoplankton (Shim 1994).
2.3 Data analysis
Euphotic depth (Zp) was estimated as Zp = 4.61/Kd according to Cloern (1987), where Kd is light extinction coefficient (Kd = 1.7/Zs) and Zs is transparency measured with a secchi disk (Poole and Atkins 1929). The transparency-driven euphotic depth has been applied to global coastal waters and to Korean coastal waters like Gwangyang Bay (Kang et al. 2020b). Principal component analysis (PCA) was conducted to detect environmental variables affecting the phytoplankton distribution and to rank the environmental components with contribution accordingly. Correlation analysis (CA) was peformed to analyze the correlation between the major environmental variables and phytoplankton groups. Linear regression analysis (LRA) was performed to identify the relationships between major phytoplankton groups and phosphate and autotrophic bacteria, respectively. Statistics were performed using R version 3.6.3 (R Foundation for Statistical Computing, Vienna, Austria) with packages of ‘vegan’ for PCA and ‘corrplot’ for CA. Plots were generated using a R package of ‘ggplot2’ or Ocean Data View.
3. Results
3.1 Spatial distribution of environmental variables
Surface water temperature ranged from 17.80 to 19.40°C (18.48±0.71°C; mean ± standard deviation; Fig. 2A). The surface water temperature was the lowest at st. 4 (17.8°C) in the inner bay, and gradually increased toward outer bay (19.4°C) and Yeosu Habor (19.3°C; Fig. 2A). Surface salinity varied from 31.87 to 32.91 (32.22±0.36; Fig. 2B). While DO ranged from 7.06 to 7.64 mg/L (7.40±0.2 mg/L; Fig. 2C), DO was the highest at st. 4 (7.64 mg/L) and the lowest at st.3 in the outer bay (7.06 mg/L; Fig. 2C). pH ranged from 7.90 to 8.12 (8.06±0.08; Fig. 2D) and lowered toward Yeosu Harbor (7.90) but increased toward outer bay (8.12). Kd showed 0.13 to 0.42 (0.31±0.12, Fig. 2E) and decreased from outer bay to inner bay. DIN levels varied from 0.68 to 11.02 μM (4.38±4.19 μM, Fig. 2F) and highly varied with the lowest value (0.68 μM) at st. 5 and the highest value (11.02 μM) at st. 1 (Fig. 2F). DIP levels ranged from 0.16 to 0.79μM (0.42±0.25 μM, Fig. 2G) with the highest level (0.79 μM) at st. 1 near Yeosu Harbor and the lowest level (0.16 μM) at inner bay. Si(OH)4 levels varied from 7.42 to 16.84 μM (11.47±3.79 μM; Fig. 2H) while Si(OH)4 highest level (16.8 μM) at st. 1 Yeosu Harbor and the lowest level (7.4 μM) at the center of bay.
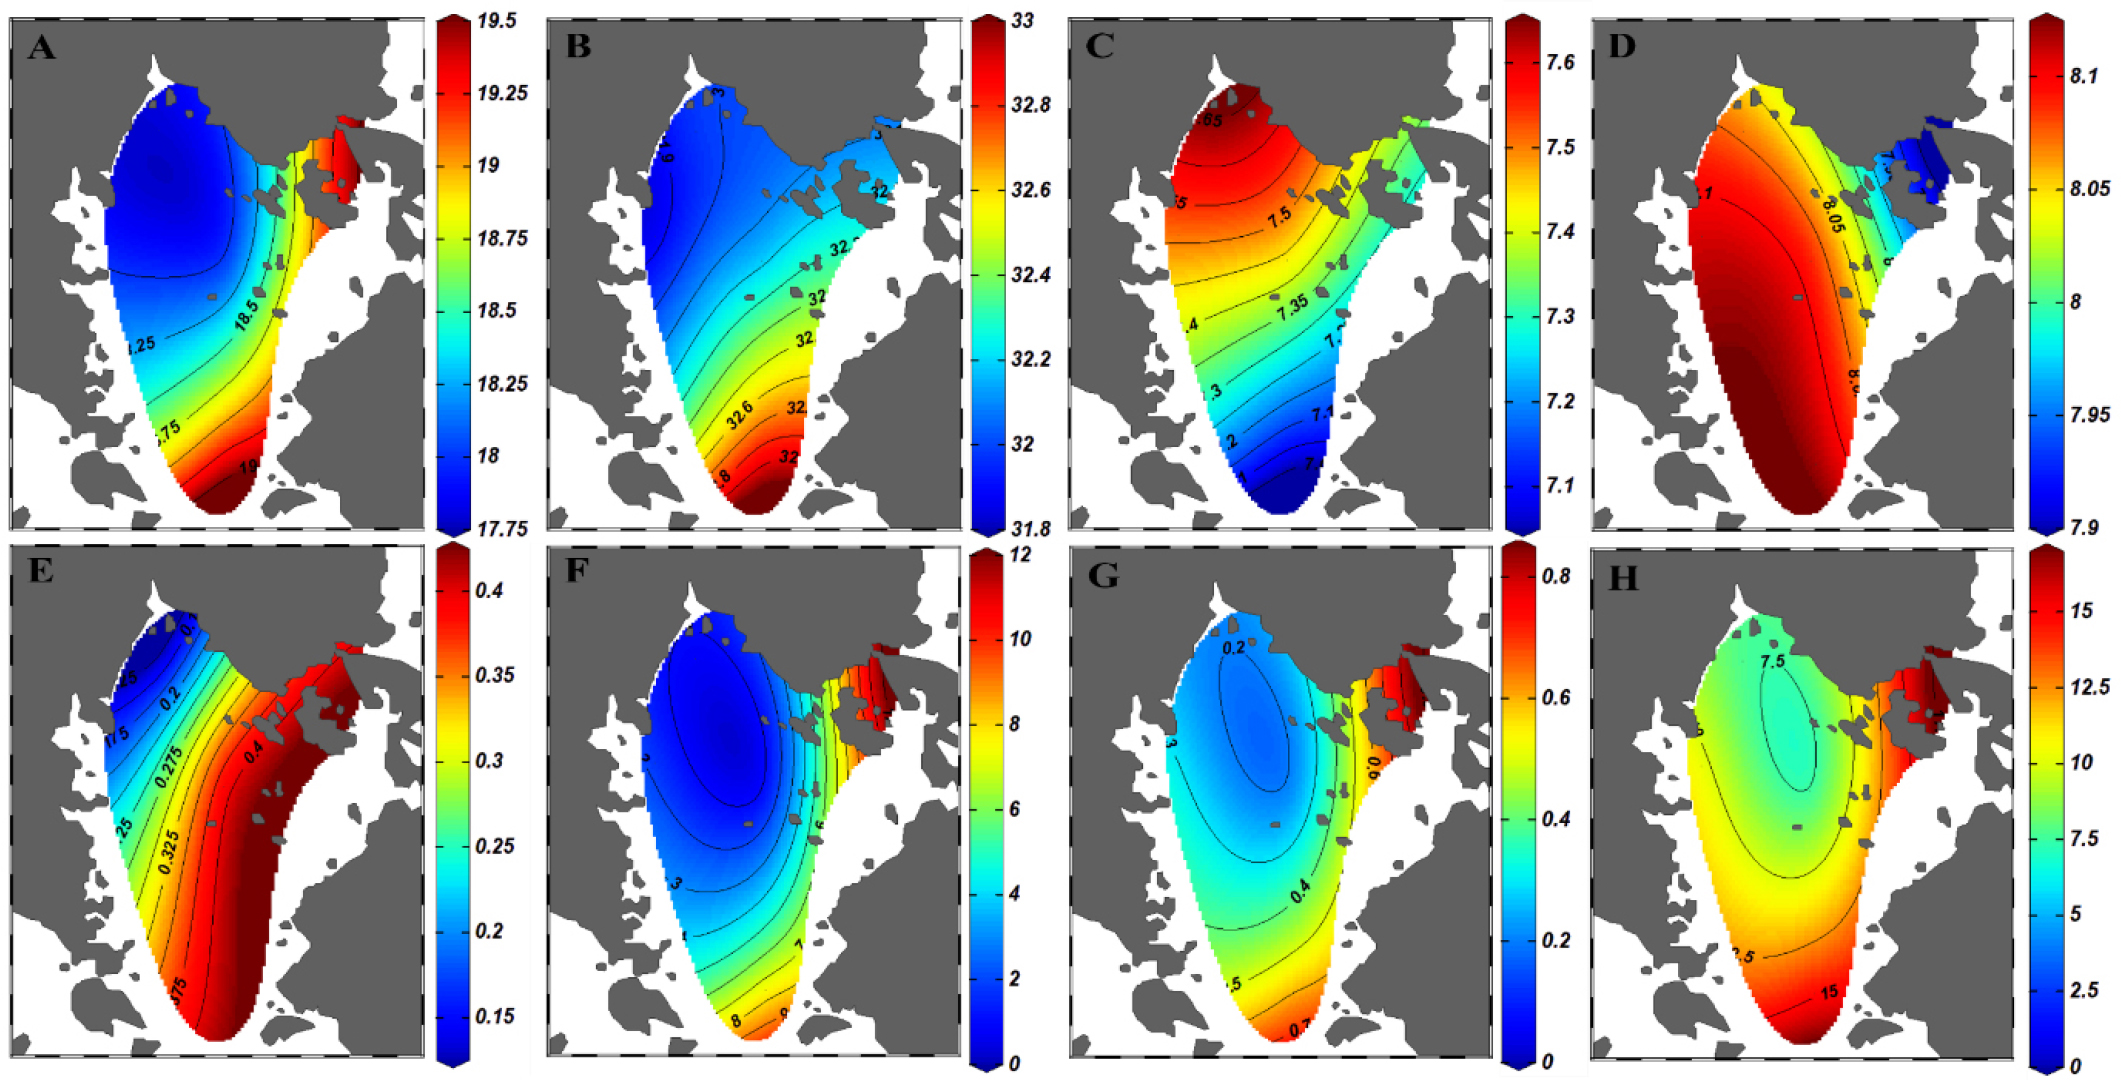
Fig. 2
Physical and Chemical variables of the surface waters in Gamak Bay in Nov, 2021. A) temperature (°C) in the surface water, B) salinity in the surface water, C) DO (mg/L) in the surface water, D) pH in the surface water, E) A light extinction coefficient (Kd) in the surface water, F) DIN (Dissolved Inorganic Nitrogen) in the surface water, G) DIP (Dissolved Inorganic Phosphate) in the surface water, H) Si(OH)4 (μM) in the surface water.
3.2 Spatial distribution of phytoplankton
Size-fractionated phytoplankton biomass (Chl a) was measured by filtering seawater onto the polycarbonate membrane filters with the pore size of 0.2 μm, 2 μm, and 20 μm, respectively. Chl a for microplankton (> 20 μm) were 0.49 to 4.15 μg/L (1.5±1.4 μg/L; Fig. 3A). Chl a for microplankton was the highest near Yeosu harbor (4.15 μg/L), and the lowest toward outer bay (0.49 μg/L; Fig. 3A). Chl a for nanoplankton (2 to 20 μm) varied from 0.37 to 1.25 μg/L (0.80±0.34 μg/L, Fig. 3B), while the highest concentration was between Yeosu harbor and outer bay (1.25 μg/L) and the lowest concentration was in the inner bay (0.37 μg/L; Fig. 3B). Chl a for picoplankton (< 2 μm) ranged 0.34 to 2.90 μg/L (0.92±0.99 μg/L; Fig. 3C), and the highest concentration was at the outer bay (2.90 μg/L) and the concentration decreased toward the inner bay (0.35 μg/L).

Spatial distribution of phytoplankton community was assessed after phytoplankton communities were quantified using a microscope and a flow cytometer. The abundance of autotrophic bacteria (the combination of PC cyanobacteria and PE cyanobacteria) ranged from 9,977 at inner bay – 19,712 cells/mL in the inner bay (Table 1), while the abundance decreased toward Yeosu harbor and increased toward inner bay (Table 1). The picoeukaryote abundance varied from 33 in the inner bay to 78 cells/mL in the outer bay (Table 1) . The diatom abundance varied from 4,320 to 64,260 cells/L throughout the bay with the highest value near the Yeosu Harbor and the lowest value in the center of the bay (Table 1). The dinoflagellate abundance varied from 0–1,980 cells/L with the absence in the outer bay and the highest value in the inner bay (Table 1).
Spatial distribution of the dominant species differed among stations. Skeletonema costatum, Thalassiosira sp, Chaetoceros curvisetus were the dominant diatoms near Yeosu Harbor as 43,740 cells/L, 5,700 cells/L, and 4,200 cells/L, respectively. However, the cell density of the dominant species decreased to 1,980+3,245 cells/L, 1,740+1,103 cells/L, and 2,025+1,731 cells/L, respectively, in other regions (Table 1). In the inner bay, Katodinium glacum, Protoperidinium pacificum, Protoperidinium sp. predominated with 720 cells/L, 420 cells/L, and 420 cells/L, respectively (Table 1).
Table 1.
Species abundance (cells/L) of phytoplankton in Gamak Bay in Nov, 2021. Autotrophic bacteria (PC cyanobacteria and PE cyanobacteria) and Picoeukaryotes are measured by flowcytometry analysis. Diatoms, dinoflagellates, silicoflagellates are identified with microscope observation.
3.3 Relationship between the environment variables and major phytoplankton groups
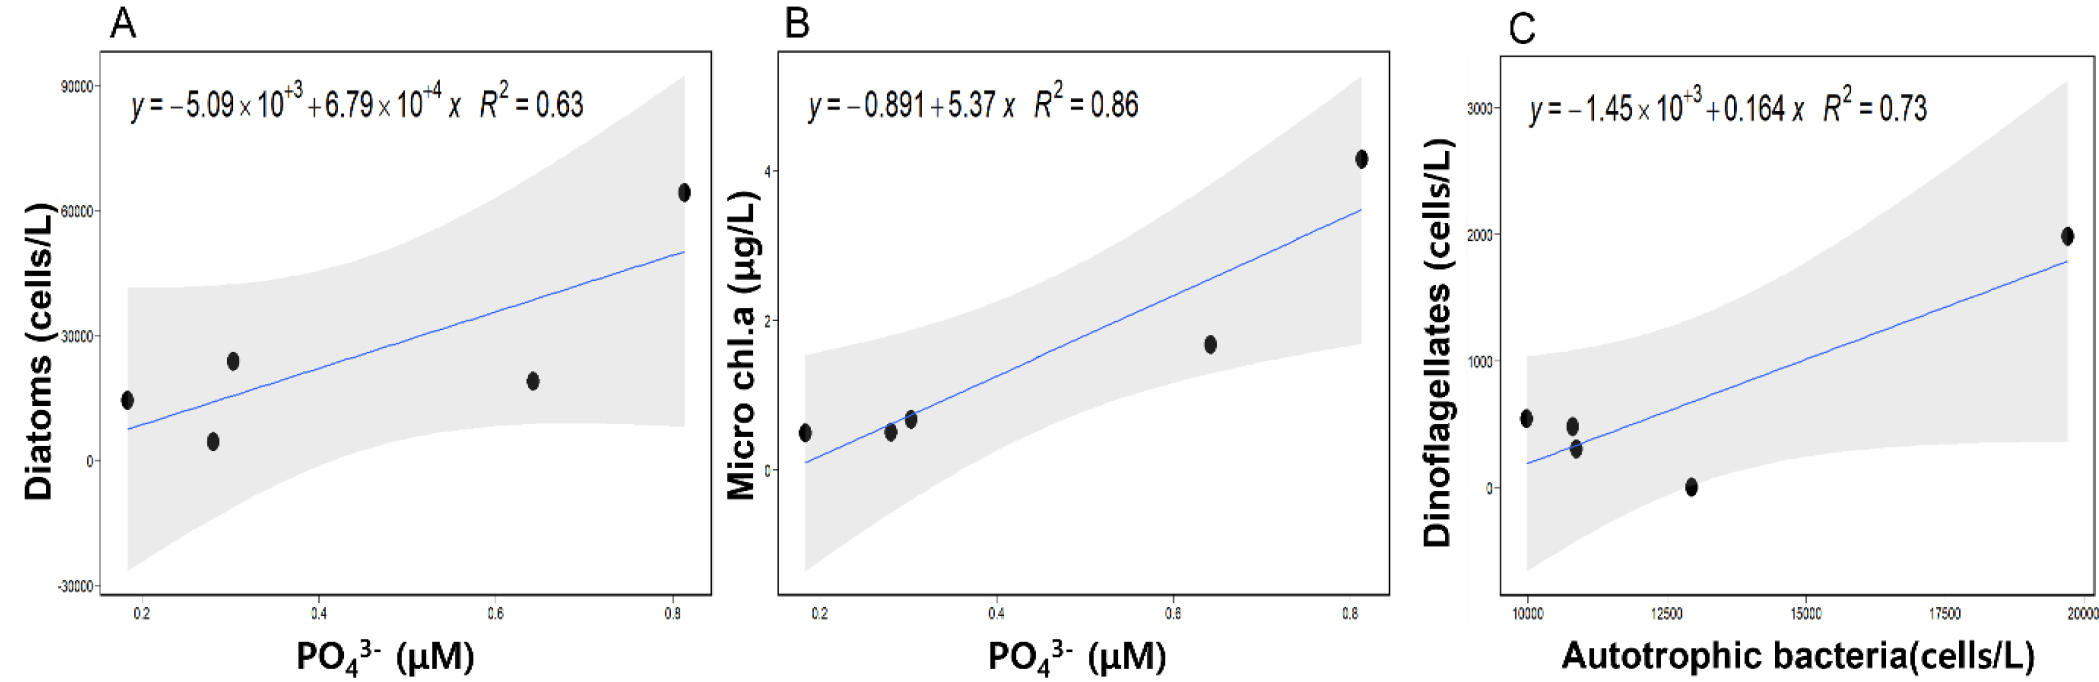
Principle component analysis (PCA) was conducted to investigate the most influential environmental variable in this ecosystem, and showed that PO43- affected the most on the Fall ecosystem of Gamak Bay (Fig. 4A). The contribution of each environmental variable exhibited the impact of PO43- exceeded 12%, which was above the significant level (Fig. 4B). Correlation analysis (CA) was performed to estimate the strength of relationship between the environmental variables and major phytoplankton groups (Fig. 5). As a results of CA, the microplantkon biomass (chla) was positively correlated with DIP (the strength of 0.92) and DIN (0.84; Fig. 6), while diatoms had a strong positive correlation with DIN (0.82) and DIP (0.79; Fig. 6) but dinoflagellates has a negative correlation with nutrients including DIN (–0.66), DIP (–0.68), and Si(OH)4 (–0.86; Fig. 6). In the meantime, autrotrophic bacteria was positively correlated with dinoflagellates (0.85; Fig. 6). Linear regression analysis (LRA) was performed to estimate the diatom abundance and the microplantkon Chl a concentration as a function of PO43- (R2 = 0.63 and 0.86, respectively), and the dinoflagellate abundance as a function of autotrophic bacteria (R2 = 0.73; Fig. 6).


4. Discussion
This study exhibits that distribution of major phytoplankton groups such as diatoms and dinoflagellates, varies depending on different nutrient strategies in phytoplankton. In Yeosu Harbor, where diatoms were abundant, the diatom abundance was associated with dissolved inorganic nutrients, while in inner bay, where dinoflagellates were abundant, the abundance of autotrophic bacteria was highly associated with dinoflagellate abundance. Particularly, the diatom distribution was largely coincident with the DIP distribution while the distribution of heterotrophic dinoflagellates was largely concomitant with the prey distribution (i.e., autotrophic bacteria). This study highlights that nutritional strategies can govern the distribution of major phytoplankton groups while defining the ecological niche of the major phytoplankton groups in Gamak Bay in the fall.
4.1 Environmental conditions and phytoplankton community distribution in Gamak Bay
Gamak Bay was clearly defined by three water masses including the inner bay, outer bay and Yeosu Harbor, largely due to a significant difference in environmental factors such as salinity and temperature. Intrusion of offshore seawater highly contributes the saline water in Gamak Bay while freshwater input from Yeosu Harbor often induces relatively low saline waters in the inner bay and Yeosu Harbor (Lee 1992). While the light extinction coefficient was low in the inner bay, the high light extinction coefficient was detected in the outer bay and Yeosu Harbor, where sallower euphotic depths were measured. High light extinction coefficient in the outer bay and Yeosu Harbor indicates that higher suspended matter might reduce light penetration in the region. Uneaten food or urinary products often cause high organic matter around fish farms (Bouwman et al. 2013), and tides move the suspended matter in the bay (Lee 2013). Thus, outer bay and Yeosu Harbor were experienced the low light penetration, potentially due to the released organic matter from fish farms located in the outer bay in Gamak Bay. Dissolved inorganic nutrients were high in the outer bay and Yeosu Harbor, indicating that the aquaculture farms were one of the major sources of nutrients in the bay and the anthropogenic input from Yeondeung creek and Seomjin River was not negligible. Consistently, Yeosu Harbor waters are mainly influenced by waters from Yeondeung Creek and Seomjin River (Lee and Cho 1990), and fish farms are located in the outer bay and shellfish farms are actively practiced in the middle and inner bay (Noh et al. 2006).
Diatoms and dinoflagellates mainly composed of the major microplankton groups throughout Gamak Bay. Diatoms were most abundant in Yeosu Harbor (St. 1) while dinoflagellates were dominant in the western region of Gamak Bay (St. 5). Size-fractionated Chl a showed that Chl a for microplankton was the highest in Yeosu Harbor, indicating that diatoms were the major contributor of microplankton in Chl a. Yoon (2000) suggested that high Chl a in the Northern Gamak Bay region could be associated with diatoms as the role of Si(OH)4 was relatively subtle due to the presence of high Si(OH)4 levels. Oh et al. (2009) demonstrated that Skeletonema costatum and Pseudo-nitzschia pungens were the predominant species in the Northern region of Gamak Bay in the Fall as our data also showed that Skeletonema coastatum, Pseudo-nitzschia pungens, and Chaetoceros curvisetus were the most dominant species in the similar region.
Although dinoflagellates observed in this study were microplankton (Table 1), Chl a for microplantkon was not significantly high at St. 5, where high abundance of dinoflagellates was observed. This was potentially due to high contribution of heterotrophic dinoflagellates to the microplankton community of St. 5. Consistent with our results, Sai Elangovan and Padmavati (2017) showed that heterotrophic abundance was negatively correlated with Chl a concentrations in coastal waters around South Andaman Islands, India, suggesting that Chl a was derived from autotrophic or mixotrophic phytoplankton. While heterotrophic flagellates are often more significant consumers on diatoms than copepods or other mesozooplankton (Sherr and Sherr 2007), Protoperidinium group, one of abundant Genus of heterotrophic flagellates in this study, feeds on diatoms (Jeong et al. 2004). Additionally, the abundance of heterotrophic dinoflagellate cysts is also closely correlated with the abundance of diatoms in the southern coastal waters of Korea (Kang et al. 2021).
4.2 Positive correlation of diatoms with DIP
Although Si(OH)4 is a major driver of diatom blooms (Goldberg et al. 1951) and Si(OH)4 levels greater than 2 µM often drive the phytoplankton community succession to diatoms (Egge and Aksnes 1992), Si(OH)4 levels exceeded 8 µM throughout Gamak Bay and a previous study also described that the diatom distribution was not likely associated with Si(OH)4 in the study region (Yoon 2000). Beyond the role of Si(OH)4 in the diatom distribution, DIP was most associated with diatom abundance in this region (R2=0.79; Correlation Analysis) while PCA illustrated that DIP was the most influential factor in the Gamak Bay ecosystem. Under the Si(OH)4-sufficient condition, the amount of DIP can control the diatom growth, and low DIP levels often induce the dominance of flagellates (Egge 1998). Low DIP levels can inhibit the diatom growth but occur blooms of non-silicious species in the Changjiang River estuary and adjacent coastal waters (Zhou et al. 2008). Meanwhile, the DIP limitation decreases phytoplankton abundance and primary productivity in the Yellow Sea (Lin et al. 2005).
In addition, a high positive correlation between COD and phaeopigment indicates that nutrient regeneration is likely to induce high primary productivity in the bay (Noh et al. 2006). the nutrient transport dominantly occurs in the surface water of Gamak Bay while the bottom water mainly experiences the nutrient accumulation or regeneration (Kim 2003). Release of soluble phosphate from the surface sediments into the water column is one of major phosphate sources in Gamak Bay because more than 70% of labile form of phosphate exists in the surface sediments (Kim et al. 2011). Thus, the diatom distribution in Gamak Bay in the Fall was highly attributable to the DIP, potentially regenerated from organic matter or released from the surface sediments.
4.3 Positive correlation of dinoflagellates with autotrophic cyanobacteria
While mixotrophy is widely defined as the combined ability of photosynthesis and heterotrophy in a single marine planktonic organism (Caron 2016), heterotrophy is often defined as the ability to feed on diverse prey including bacteria, picoeukaryotes, nanoflagellates, diatoms, and dinoflagellates, etc. with the various feeding mechanisms (Jeong et al. 2010). The dominance and biomass of mixotrophic or heterotrophic dinoflagellates largely depend on the influence of prey items (Alf et al. 2000; Stoecker and Lavrentyev 2018). Dinoflagellate community in Gamak Bay was composed of various mixotrophic and heterotrophic species; mixotrophic species of Alexandrium sp., Katodinium glaucum, and Prorocentrum sp., and heterotrophic species of Protoperidinium minisculum, Protoperidinium pacificum, and Protoperidinium sp. Diatoms were dominant in Yeosu Harbor whereas dinoflagellate abundance was highest in the western inner bay, which is coincident with high abundance of autotrophic cyanobacteria. Particularly, bacterivore (i.e., feeding on bacteria) often relieves inorganic nutrient limitation in oligotrophic ocean (Stoecker et al. 2017), and a variety of harmful algal dinoflagellates belonging to the genus of Prorocentrum and Alexandrium can feed on Synechococcus sp. with highly comparable ingestion rates (Jeong et al. 2005). Significantly high correlation coefficient (R2 = 0.85) between dinoflagellates and autotrophic cyanobacteria indicates that the role of mixotrophic or heterotrophic dinoflagellates cannot be ignored in the planktonic food webs in Gamak Bay.
4.4 Further directions
Encompassing a diverse nutritional mode is a major strategy of plankton protists for survival or growth (Caron 2016). Although it has been reported that the DON availability determines the ecological niche of diatoms and dinoflagellates in the adjacent estuarine ecosystem of Gwangyang Bay (Kang and Kang 2022), the role of mixotrophy or heterotrophy has not been investigated in Gamak Bay. Mixotrophy induces a three-fold increase in a mean size of organism through the efficient transfer of biomass to larger classes (Ward and Follows 2016). Coastal warming has been on-going in the southern coastal waters of Korea (Kang et al. 2019), and warming drives a shift of mixotrophs towards more heterotrophs with higher growth rates (Liu et al. 2021). In Gamak Bay, a long-term trend in Chl a showed that phytoplankton biomass has declined, indicating that small phytoplankton may be an important player in this ecosystem (Oh and Kang 2022). With the rising importance of small phytoplankton, our study implies that mixotrophic or heterotrophic strategy in protists will be enhanced in this ecosystem. Then, it is necessary to study how mixotrophs/heterotrophs will affect marine organisms in aquaculture farms, particularly, the filter feeders such as mussels and oysters in Gamak Bay.
