

1. Introduction
Coastal environments are the Earth’s most productive ecosystems and are of great economic (Zemke-White and Ohno 1999; Jung and Choi 2020) and industrial importance, as 40% of the world’s population and two-thirds of the fifty largest cities worldwide are located along the coast (Kim et al. 2011; Jung and Choi 2022). Therefore, systematic management of coastal ecosystems is crucial due to their close connection to human life. Recently, marine ecosystems in coastal waters have been devastated by environmental pollution, global warming, and rising water temperatures. In turn, this has led to an acceleration of barren ground formation in Korean coastal waters (Bates and DeWreede 2007; Choi et al. 2010; Jung et al. 2022).
Given the unique characteristics of each of the environments that encompass the marine ecosystems of Korea, it is essential to scientifically analyze the habitat, biomass, and distribution of marine organisms in each sea area (Jordan et al. 2005). Understanding the unique characteristics of each area is crucial for constructing seabed topography. Therefore, securing basic data on marine organism density and biomass is necessary for conservation efforts and the preservation of large-scale marine algal communities (Blamey and Branch 2009; Jung et al. 2022).
In aquatic environments, flora and fauna are considered key biomarkers that can be monitored (Wells et al. 2007; Orfanidis et al. 2011), and long-term aquatic biota data are particularly useful for estimating changes in biological populations affected by environmental factors (Rindi and Michael 2004; Zhai et al. 2022). The subtidal zone is known for its high biodiversity and productivity, and therefore marine biocommunity research in these ecosystems is crucial for the conservation and sustainable use of marine environments (Gonzalez-Rivero et al. 2014; Nguyen and Liou 2019).
Multi-beam survey technology has been found to be a superior alternative in terms of accuracy, cost-effectiveness, and directional detection compared to traditional bathymetry that relies exclusively on single-beam methods (Webster et al. 2019; Xiao et al. 2019; Johnson 2020). This approach provides a high-resolution detection area (footprint) by using narrow beam angles. Moreover, with the appropriate application of frequency and signal processing, it can achieve a level of accuracy suitable for various purposes such as navigation hazard analysis, waterway and dredging surveys, identification of artificial reefs, and provision of safe navigation information (Kim et al. 2001). Multi-beam systems allows for real-time data collection, filtering, editing, measurement, and visualization, thus contributing to the establishment of a marine information database including bathymetric measurements, 3D seabed topography, identification of artificial reefs and ship safety navigation information (Cho and Choi 2018).
Multi-beam bathymetry involves measuring the depth of the sea area and obtaining various types of information by calculating seafloor topographic data using different methods to enhance accuracy based on the research objectives (Jung et al. 2006). However, the application of seabed topography has been limited due to limitations in post-data acquisition processes (Montes-Herrera et al. 2021). Therefore, our study sought to facilitate the utilization of seabed topography by combining it with ecomapping analysis to incorporate marine ecological information.
Field survey generate large amounts of diverse data, and ecological variations are defined by complex phenomena, which are in turn influenced by various factors. Therefore, in-depth understanding, observation, and analysis of various types of data are needed to understand and identify causal relationships between the aforementioned phenomena (Boulton et al. 2016). To this end, integration and management of dispersed data across multiple fields, along with scientific visualization, are necessary to generate marine ecological data based on seabed topography that can be analyzed in both spatial and temporal dimensions.
Korea’s coastal marine ecosystem is known for its rapid structural fluctuations. Therefore, we established a representative research base (model station) for sandy-underwater rock ecosystems, a key habitat, and applied standardized eco-mapping research techniques to characterize the study site (Parry-Wilson et al. 2019). This study was conducted to investigate habitat environments, organism dynamics, and distribution to identify their relationships and interplay, in addition to laying the foundation for effective coastal management and conservation. Therefore, the findings of this study underscore the importance of establishing habitat information for climate change and anthropogenic environmental changes. Most notably, the characterization of coastal habitats must be based on comprehensive and useful data to gain accurate insights into there various functions within marine ecosystems.
2. Materials and Methods
For each sea area in Korea, research stations were selected to qualitatively and quantitatively identify marine algal community structures and habitat characteristics. Research was conducted in Uljin, Pohan, and Ulju on the east coast, Tongyeong, Namhae, and Geomundo on the southe coast, and Chujado, Seongsan, and Udo on Jeju island. Subtidal samples were collected through underwater diving surveys (SCUBA diving) at designated research points and analyzed accordingly. Quantitative research on marine algal communities was conducted using 50 cm × 50 cm quadrats divided into 25 sections, and marine algae that appeared in each quadrat were collected for each study site. Additionally, the surrounding sea conditions within the 4 ha study area were recorded using underwater scooters and action cameras (GoPro, HERO4 SILVER).
Marine algae collected from each study site were fixed with a 5%-10% formalin-seawater solution at the site and transported to the laboratory in an ice box for classification and identification. The samples were then thoroughly washed with fresh water in the laboratory, classified by type, and weighed to obtain weight per unit area (m2). Aadditionally, qualitative analysis was conducted by collecting and analyzing the marine algae inhabiting the substrate of the study site.
To characterize the ecological features of each study sites, our study focused on marine algal species, major composition, dominant species (determined in order of highest biomass among emerging marine algae), barren ground types, and ecological conditions by habitat. Additionally, a comprehensive survey covering the entire 4 ha area was conducted, after which the obtained samples were quantitatively and qualitatively analyzed in the laboratory. Underwater ecological photographs and herbivore density measurements were used for further analysis, along with recorded underwater images for habitat characterization barren ground identification, herbivore presence, algal species, and other ecological attributes.
Sensor calibration involved determining the relative distances of each sensor (DGPS, motion sensor, and transceiver) based on the central reference point (CRP). The X-axis represented the left-right direction, the Y-axis represented the front direction, and the Z-axis represented the top-bottom direction. Each axis was indicated by a negative and positive sign. The CRP defined as the ship’s center of gravity and the reference point for location and depth information, was used to correct the multi-beam depth measurement data.
Calibration was performed onboard the vessel by comparing the depth data acquired from the multi-beam sounder with another sounder’s data. This process determined the offset angle of the multi-beam sounder, minimizing depth data errors. Calibration areas typically included water depths of 8 to 15 m exhibiting flat topography, protruding rocks and slope areas.
Regular measurements of sea level changes and their correction were conducted due to the influence of tides during water depth measurement. Real-time tidal data were obtained from tidal stations near the Korea Hydrographic and Oceanographic Agency, and corrections were made accordingly to ensure accurate depth measurements.
Various types of multi-beam echo sounding data were simultaneously stored, including acquisition date, time (hundredths of a second), location (latitude and longitude coordinates received from GPS), and vessel speed (vessel speed calculated via GPS). The research data underwent an editing process to correct miscalculations resulting from the sea and surrounding conditions during observation. Step-by-step corrections were made for tides and each data point to ultimately obtain the actual water depth.
3. Results
The East Sea and Jeju waters in Korea offer favorable conditions for seaweed growth and the maintenance of marine forest. Compared to other sea areas, these regions have sandy, rocky, and gravel substrates, low suspended matter in the water column, and low turbidity. In contrast, the South Sea presents less favorable environmental conditions for algae growth and marine forests maintenance. This region is characterized by high turbidity and significant sediment deposition on the substrate. However, seaweed communities with large brown and small red algae populations coexist, indicating the potential for creating marine ecosystems and marine forests suited to the characteristics of these sea areas.
The main dominant species along the east coast in terms of biomass include Pachyarthron cretaceum, Plocamium telfairiae, Agarum clathratum, Codium hubbsii, Sargassum spp., Gracilaria textorii, Acrosorium polyneurum, Grateloupia elliptica, Gelidium elegans, Grateloupia cornea, Rhodymenia intricata, and Callophyllis japonica. The south coast is mainly dominated by Chondrus ocellatus, Ecklonia stolonifera, Grateloupia elliptica, Ulva australis, Grateloupia cornea, S. hemiphyllum, S. micracanthum, Corallina piulifera, Amphiroa beauvoisii, A. anceps, S. macrocarpum, Myagropsis myagroides, E. cava, and S. patens. In the case of Jeju Island, the dominant species include S. macrocarpum, S. micracanthum, S. coreanum, Marginisporum crassissimum, A. anceps, E. cava, Codium coactum, G. angusta, C. officinalis, S. patens, and M. myagroides. Among them, large brown algae, which are the dominant species constituting the marine forest, include A. clathratum and Sargassum spp. in the East Sea; E. stolonifera, S. hemiphyllum, S. micracanthum, S. macrocarpum, M. myagroides, E. cava, and S. patens in the South Sea; and S. macrocarpum, S. micracanthum, S. coreanum, E. cava, S. patens, and M. myagroides in Jeju island (Table 1).
Table 1.
Dominant marine algal species according to the biomass of the study area.
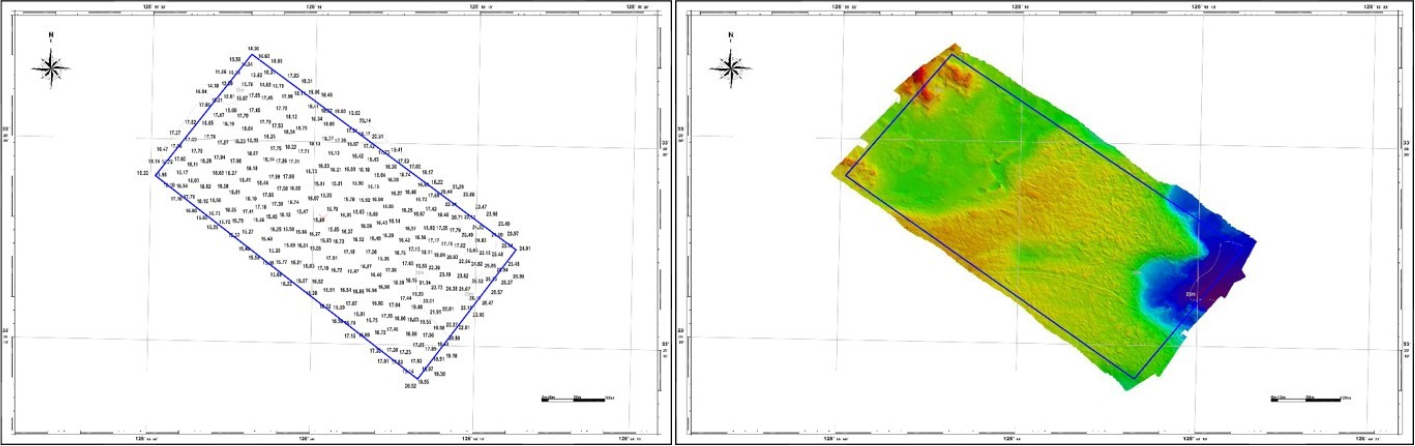
A careful examination of the survey area’s bedrock revealed that it is approximately 1.6 km from the coastline, with no identified obstacles such as fishing grounds. The water depth in the sea area ranged from 11.6 to 26.57 m, gradually deepening from the coastline towards the open sea. Most of the water depth exhibited a gradual distribution within 20 m, with shallow areas in the north and some relatively deeper areas in the west (Fig. 1). Apart from a few sloped rocks in the northwest, the majority of the area consisted of flat rocks (85%) with a mixed sandy terrain, whereas non-rock areas were found in the deeper water region in the west.
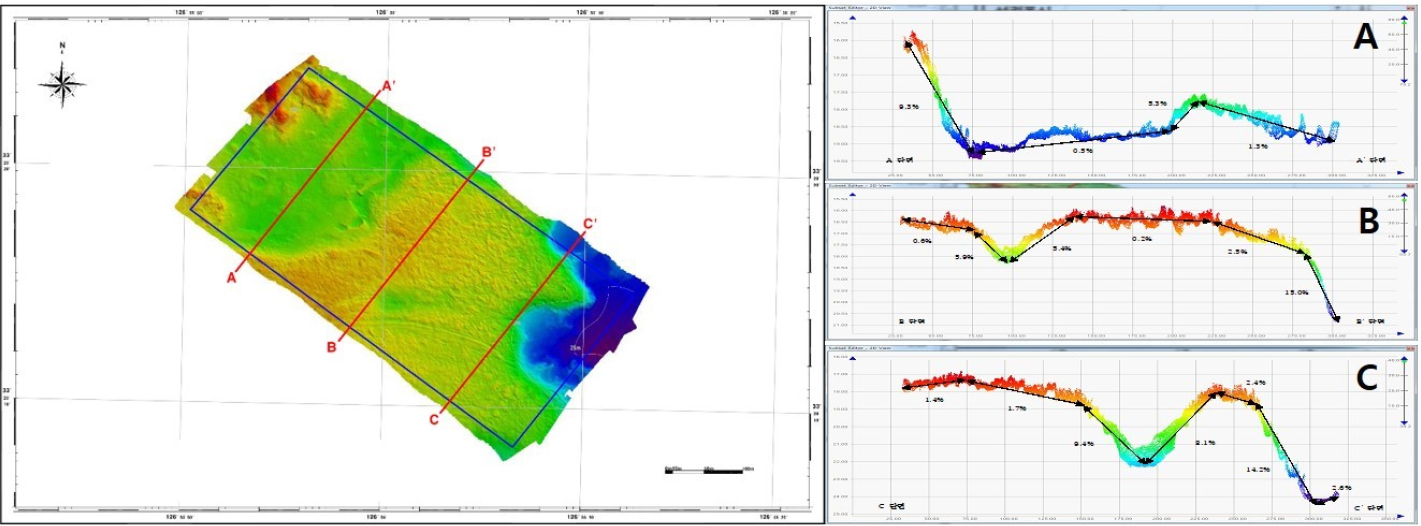
The sea area gradient was generated using a 1 m resolution file extracted from bathymetric data. Most of the area consists of flat rock, but several changes in water depth were observed in the topography, which was characterized by the formation of submarine valley (Fig. 2).
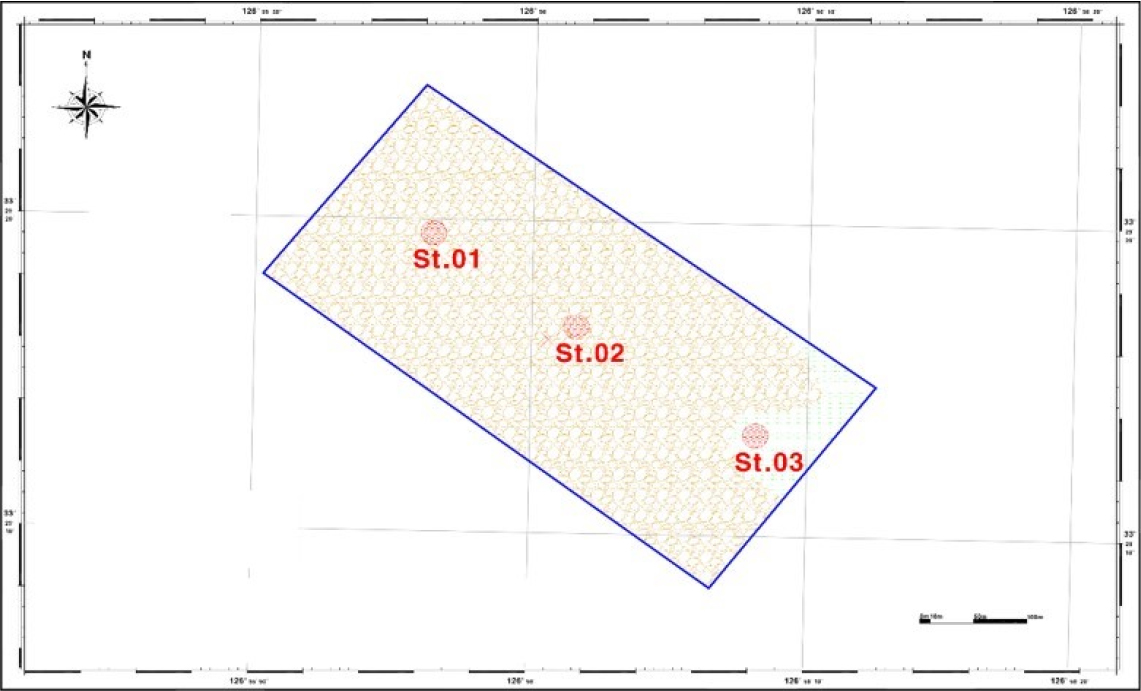
Upon examining the sediment characteristics, it was determined that St.03 represents a sandy site. Apart from this peak, the majority of the area was identified as bedrock (Fig. 3).
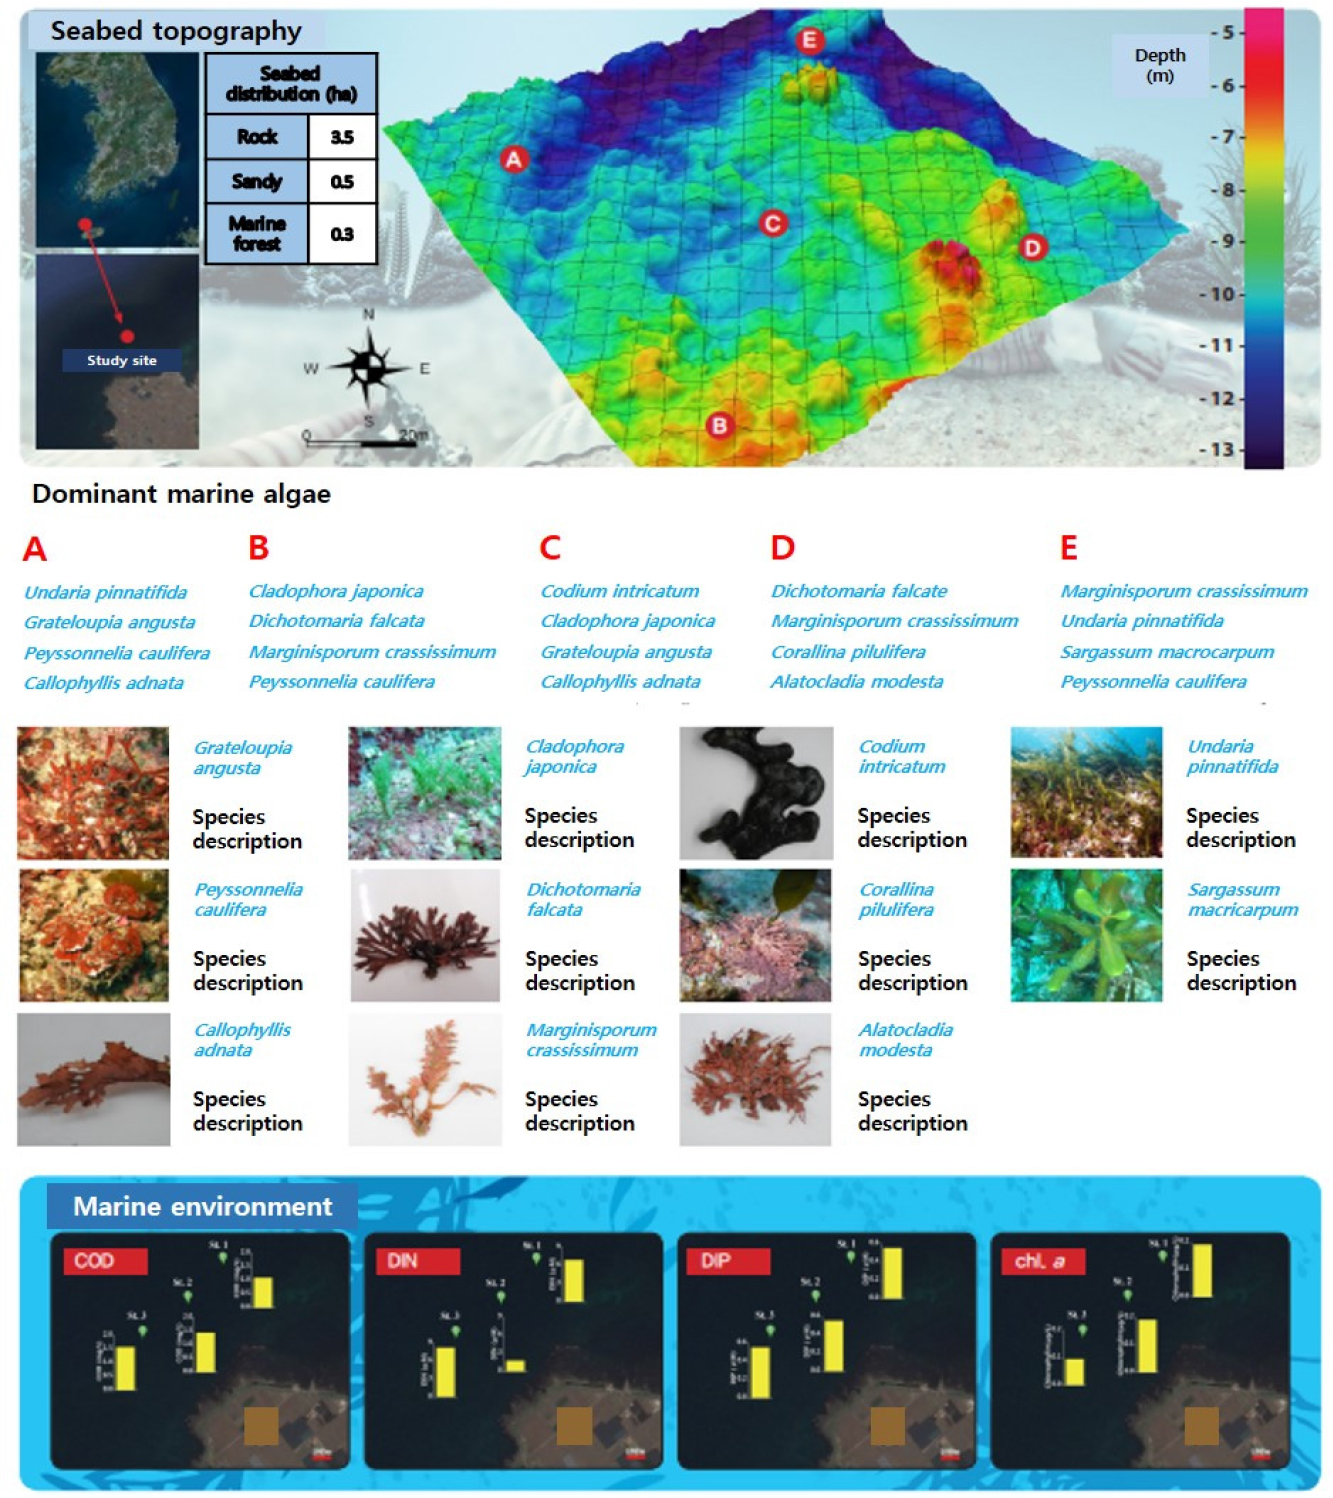
As mentioned earlier, the marine ecological map shown in Fig. 4 was created by integrating the marine environment, nutrient concentration, seaweed distribution, and sediment characteristics studied within the area. This marine ecological information map provides convenient access to various information on the target sea area in a single place. Therefore, the establishment of this ecological information map provides a crucial basis for determining specific sea area information in the future.
4. Discussion
In marine forest (e.g., kelp forests, seaweed forests, seaweed beds), large brown algae such as Saccharina spp., Ecklonia cava, E. stolonifera, and Eisenia bicyclis dominate the natural ecosystem (Kain 1982; Steneck and Dethier 1994; Choi et al. 2003; Kang 2016; Park et al. 2017). These species from communities along with small red algae, green algae, and other brown algae. The term also encompasses a community consisting of seaweed and seagrass (Wernberg et al. 2019; Choi et al. 2020; Olsson et al. 2020). Within the subtidal zone, large-scale brown algae, including Sargassum spp., Saccharina spp., E. bicyclis and E. cava, form extensive communities on bedrock at depths ranging from 2 to 3 and up to 20 m. Flowering plants, such as Zostera spp. tend to densely grow in sandy areas. The dense growth of seaweed communities in the marine forest serves as spawning grounds and nurseries for fish, attracting various marine organisms. Particularly, abalone, sea urchins, and other valuable aquatic organisms thrive and proliferate in these enclosed environments (Fagerli et al. 2013; Jeon et al. 2015). Moreover, given the epiphytic nature of these organisms, they fulfill ecological functions that directly impact biological production. Additionally, they play a crucial role in environmental stabilization, including environmental purification and substrate stabilization (Ida et al. 1967; Crawford et al. 2002; Matthews and Whittaker 2015).
Habitat characteristics play a vital role in the study of sea forests, which are crucial components of marine ecosystems. However, there has been a lack of awareness regarding the acquisition and utilization of information on habitats and seabed topography in marine forest research. Collaboration between marine biology and undersea topography researchers has been scarce, resulting in a lack of applied studies. By incorporating the concept of habitat into seafloor topography research and combining it with the biological characteristics of hard and soft substrates, marine ecological information can be more accurately and diversely represented. Therefore, the analysis of marine ecological information and the creation of a seabed topography-based database would greatly contribute to future research endeavors (Jordan et al. 2005).
Previous studies have collected ultrasonic signals from mud, sand, pebbles, fish, shellfish, and other elements on the seabed to gather data on pen shells (Atrina pectinata). Afterward, these signals were converted into digital format and stored in a database. This study revealed distinguishable signal patterns and these findings enabled the development of a detector capable of recognizing shellfish on the seabed and in mud.
The numerous complexities of the sea, including varying topography, shapes, materials, and their changes highlight the need to focus on phenomena centered around the seabed (Cerrano et al. 2017). Therefore, accurate classification of substrate conditions, composition, mixing degree, presence of discarded or live shellfish, marine life growth, and seaweed distribution is necessary.
Our findings demonstrated that the dominance of each sea area and the primary seaweed species in the marine forest can be classified based on sea area characteristics and habitat differences. Analyzing the seafloor topography data acquired through multi-beam technology and establishing habitat data suitable for seaweed growth in each sea area and marine ecological information can provide a more detailed and precise analysis of the characteristics of currently unknown sea areas. By utilizing habitat information derived from marine ecological information specific to each sea area, a solid foundation for marine ecosystem conservation can be established, promoting effective maintenance and management of the marine forest (Blamey and Branch 2009). Moreover, underwater bedrock serves as a habitat for diverse marine organisms and can be utilized as a training ground for direct observation and learning about aquatic ecosystems. Producing underwater ecology maps allows for more efficient visualization of these underwater rock ecosystems and the provision of various types of information (Zhai et al. 2022). This facilitates the rapid and accurate dissemination of information necessary for efficient coastal management and restoration of the marine ecosystem.
Habitat destruction has been steadily increasing in recent years due to global climate change, rising sea water temperature, environmental pollution, coastal construction and anthropogenic alterations (Campbell and Starko 2020; Scrosati et al. 2020; Van Son et al. 2020). However, there is a severe lack of data on the actual conditions and extent of habitat loss (Jung et al. 2006). In order to address the global decline in biodiversity, species loss, extinction, and the absence of ecological data on valuable species, multidisciplinary collaboration and the integration of various types of data are crucial (Cho and Choi 2018). Therefore, we propose a new approach and methodology for identifying marine habitat characteristics and preserving marine ecosystems through habitat analysis and the establishment of marine ecological information based on seabed topography data.
Furthermore, by employing geospatial analysis and geo-processing to quantitatively analyze long-term trends, we can provide a scientific basis for sustainable development and decision support for the management (Jung et al. 2006). Additionally, to enhance web-based information services, our study implemented multi-level map caching, a multi-layer architecture, and a geospatial database (Jung and Choi 2022). In the future, eco-mapping can be utilized to develop effective policies for the conservation of the marine environment through coastal marine enviromnent assessment and integrated management of national coastal areas. To conduct comprehensive and diverse research, it is essential to standardize research techniques, ensuring consistent results through standardized methods and data conversion.
