

1. Introduction
2. Materials and Methods
2.1 Culture conditions for the maintenance and incubation of C. vulgaris
2.2 TPLC for C. vulgaris
2.3 MLC for C. vulgaris
2.4 Biochemical composition of C. vulgaris
2.5 Statistical analysis
3. Results
3.1 Growth and biochemical composition under TPLC for C. vulgaris
3.2 Growth and biochemical composition under MLC for C. vulgaris
4. Discussion
1. Introduction
Microalgae are autotrophic organisms that support primary production in aquatic ecosystems and accumulate substantial amounts of industrially valuable lipids and carbohydrates, along with a wide range of bioactive compounds, including carotenoids. These features have led to their increasing applications as alternative food sources, nutraceuticals, aquaculture feeds, and pharmaceuticals. The growth and division of microalgae are closely regulated by light, which influences cell cycle stages, such as the growth phase (G1), DNA synthesis phase (S), premitotic phase (G2), mitotic phase (M), and cytokinesis (C) (Mitchison 1972). Most eukaryotic cells reproduce via binary fission, in which a single mother cell divides into two daughter cells. However, in many green algae, multiple fission occurs, where a mother cell produces more than two daughter cells, sometimes up to 16 (Bišová and Zachleder 2014). Multiple-fission events, which occur during the S phase of the light period, are accompanied by the accumulation of starch (as a carbon reserve) and polyphosphate (as a phosphorus reserve) through photosynthesis. Moreover, the dark period improves growth rates by reducing cellular stress through the repair of proteins, DNA, and photosynthetic systems damaged by ultraviolet (UV) irradiation and by removing reactive oxygen species (Pulz 2001). Moreover, the wavelength of light may not only indirectly influence multiple fission but also selectively stimulate intracellular photosynthetic efficiency, cell size, division rate, and biosynthetic pathways, thereby affecting the synthesis of secondary metabolites (Donnan and Peter 1983).
For industrial applications of microalgae, efficient biomass production through mass cultivation is a critical requirement. Mass cultivation methods for microalgae are broadly classified into open pond systems and photobioreactors (PBRs) (Narala et al. 2016). Although open pond systems are relatively cost-effective compared to PBRs, this method exhibits lower photosynthetic efficiency and requires extensive land areas for installation. In contrast, PBR systems equipped with artificial light sources allow the precise control of light intensity and wavelength, providing optimal conditions for microalgal growth. These systems are advantageous not only for producing high-value functional compounds but also as an effective cultivation method in Korea and Japan, where seasonal variability and limited land availability present challenges. Consequently, they are being actively used to cultivate microalgae that produce expensive bioactive compounds. However, fluorescent lamps, which are commonly used as light sources in PBRs, pose certain limitations due to their bulky structure, including low light penetration in external illumination setups and high operational and initial investment costs (Choi et al. 2012). Light-emitting diodes (LEDs) are environment-friendly light sources that provide adjustable wavelengths and finely controlled illumination durations, enabling the enhancement of microalgal growth and nutrient synthesis. Accordingly, intensive research efforts have focused on identifying optimal LED illumination strategies in PBR systems for efficient large-scale microalgal cultivation.
Recently, biotechnology (BT) has been classified into several color-coded domains based on its applications. White BT (WBT) focuses on bioenergy production, red BT (RBT) involves the extraction of intracellular compounds for use in pharmaceuticals and food, and green BT (GBT) addresses issues related to wastewater and sludge treatment, as well as food resource management (Bentahar et al. 2023). Chlorella vulgaris, the algal species used in this study, is widely recognized as a valuable resource for RBT, GBT, and WBT (Chisti 2007; Harun et al. 2010; Kumar et al. 2010; Han et al. 2023). This species accumulates a wide range of valuable intracellular compounds, including carbohydrates, proteins, lipids, and pigments, as well as essential nutrients such as minerals, vitamins, trace elements, and amino acids, highlighting its potential as a sustainable food source (Kim et al. 2014). Moreover, C. vulgaris contains a bioactive component called Chlorella Growth Factor, which has demonstrated medical benefits, including stroke prevention and recovery, anticancer effects, and protection against lifestyle-related diseases (Noda et al. 1996; Justo et al. 2001; Hasegawa et al. 1995). Therefore, this study aimed to evaluate the growth and biochemical composition of C. vulgaris PKVL7422 by comparing the results obtained from two-phased (TPLC) and mixed LED light culture (MLC) systems. The findings of this study are expected to provide a fundamental basis for the development of high-performance PBR systems and their industrial applications in the future.
2. Materials and Methods
2.1 Culture conditions for the maintenance and incubation of C. vulgaris
The green microalgae C. vulgaris used in this study was the wild-type PKVL7422 strain, originally isolated and currently maintained by the Virus Laboratory, Pukyong National University (Busan, Republic of Korea). The strain was maintained in BG11 medium prepared with ultrapure ionized water. The stock culture was grown in a BG-11 medium with the following composition: 1.5 g NaNO3, 0.04 g K2HPO4·3H2O, 0.2 g KH2PO4·3H2O, 0.0005 g Ethylene Diamine Tetraacetic Acid, 0.005 g Fe ammonium citrate, 0.005 g citric acid, 0.02 g Na2CO3, and 1 mL of trace metal solution per liter. The trace metal solution contained 2.85 g H3BO3, 1.8 g MnCl2·4H2O, 0.02 g ZnSO4·7H2O, 0.08 g CuSO4·5H2O, 0.08 g CoCl2·6H2O, and 0.05 g Na2MoO4·2H2O per liter (Rippka et al. 1979). Maintenance culture conditions were set at a temperature of 20°C and salinity of 0 psu, with a light intensity of approximately 100 μmol m–2 s–1 under a 12-h light and 12-h dark cycle (12L:12D) using cool-white fluorescent lamps (Namyoung Bulb Co, Seoul, Korea). Light intensity was measured using a quantum sensor (QSL-2100; Biospherical Instruments Inc., CA, USA). The culture medium was sterilized under low pressure using a 0.22 μm pore size filter (Vacuum Bottle Top Filter, Millipore, MA, USA). To prevent secondary biological contamination, all experimental apparatus were sterilized either by autoclaving (202 kPa, 30 min) or dry heat sterilization (185°C, 1 h). All experiments were conducted on a clean bench.
2.2 TPLC for C. vulgaris
Han et al. (2023) investigated the effects of single-wavelength irradiation on the growth and biochemical composition of the same C. vulgaris PKVL7422. They reported that a low half-saturation constant was observed under red light, whereas the accumulation of useful biological components, such as proteins and lipids, increased under blue light. Based on this report, we examined the growth and biological composition of C. vulgaris under selected red and blue light. In the TPLC experiment, red light (λmax=660 nm; LUMILEDS, TX, USA) was applied to promote cell density until the exponential phase in the first phase. During the stationary phase in the second phase, blue light (λmax=450 nm; LUMILEDS, TX, USA) was introduced to enhance the accumulation of valuable biological compositions. The light intensity for all wavelengths was maintained at 100 μmol m–2 s–1 with a 12L:12D light cycle. Temperature and salinity were consistent with the maintenance culture conditions. C. vulgaris was grown to the exponential phase and then inoculated into a 1 L culture flask to achieve a cell density of 1.2×10⁵ cells mL–1. Cell density was calculated by measuring the dry cell weight. For dry weight measurement, 10 mL of cell culture was filtered (25 mm diameter, GF/F, Whatman, Little Chalfont, UK), dried in an oven at 75°C for 2 h, and weighed. Measurements were taken every 2 days in the first phase and every day in the second phase. The specific growth rate (μ) was calculated using Equation (1), with experiments conducted in triplicate. The average value was calculated after excluding erroneous data.
μ: Specific growth rate (day–1)
N0, Nt: Initial and final dry weight at time t (days)
Δt: Duration of the exponential growth phase (days)
2.3 MLC for C. vulgaris
For the experiment on growth characteristics under MLC, red and blue LED lights were combined at ratios of 3:7, 5:5, and 7:3 (3r:7b, 5r:5b, and 7r:3b). The total light intensity was maintained at approximately 100 μmol m–2 s–1 (12L:12D light cycle) by adjusting the proportions of red and blue light. For example, in the 3r:7b ratio, the red and blue light intensities were set to 30 μmol m–2 s–1 and 70 μmol m–2 s–1, respectively. The temperature and salinity were consistent with the maintenance culture conditions. C. vulgaris was grown to the exponential phase and then inoculated into a 1 L culture flask to achieve a density of 1.2×10⁵ cells mL–1. The cell density was calculated using dry weight, as mentioned in the “TPLC for C. vulgaris” section, and the specific growth rate was calculated using Equation (1).
2.4 Biochemical composition of C. vulgaris
To analyze the biochemical composition, samples from the TPLC growth experiment were collected on day 11, corresponding to the exponential phase of the first phase, and from days 15 to 18, corresponding to the stationary phase of the second phase. Similarly, in the growth experiments with MLC, samples were harvested on day 9 for the middle exponential phase and day 17 for the stationary phase. Samples were filtered (47 mm diameter, GF/F, Whatman), dried in a dry oven (75°C, 2 h), and stored at –70°C until analysis. Carbohydrates, proteins, and lipids were analyzed using the phenol–sulfuric acid (Dubois et al. 1956), Lowry (1951), and Marsh–Weinstein (Marsh and Weinstein 1966) methods. After pretreatment, the absorbance of the supernatant was measured using a UV/Vis spectrophotometer (Xma-3000PC; Human Corp., Seoul, Korea) at 490, 750, and 360 nm for carbohydrates, proteins, and lipids, respectively.
2.5 Statistical analysis
Each experiment was conducted in triplicate, and the results are presented as mean±standard deviation. One-way analysis of variance was used to evaluate the differences in lipid content between treatments, followed by Duncan’s multiple range test for post hoc comparisons at a significance level of p & 0.05. A paired t-test was conducted to compare the first and second phases of TPLC and evaluate the differences between treatments in the MLC system. All statistical analyses were performed using the SPSS software (ver. 23.0; SPSS Inc., IL, USA).
3. Results
3.1 Growth and biochemical composition under TPLC for C. vulgaris
In the TPLC system, the first stage, conducted under red light to promote optimal growth conditions, was maintained until day 14, corresponding to the late exponential phase. The second stage, aimed at the accumulation of biological components, was performed under blue light for an additional 4 days (Fig. 1). The lag–log phase persisted until day 4, after which the exponential growth phase continued until day 14, followed by a transition into the stationary phase. The growth rate during the exponential phase was determined as 0.56 day–1.
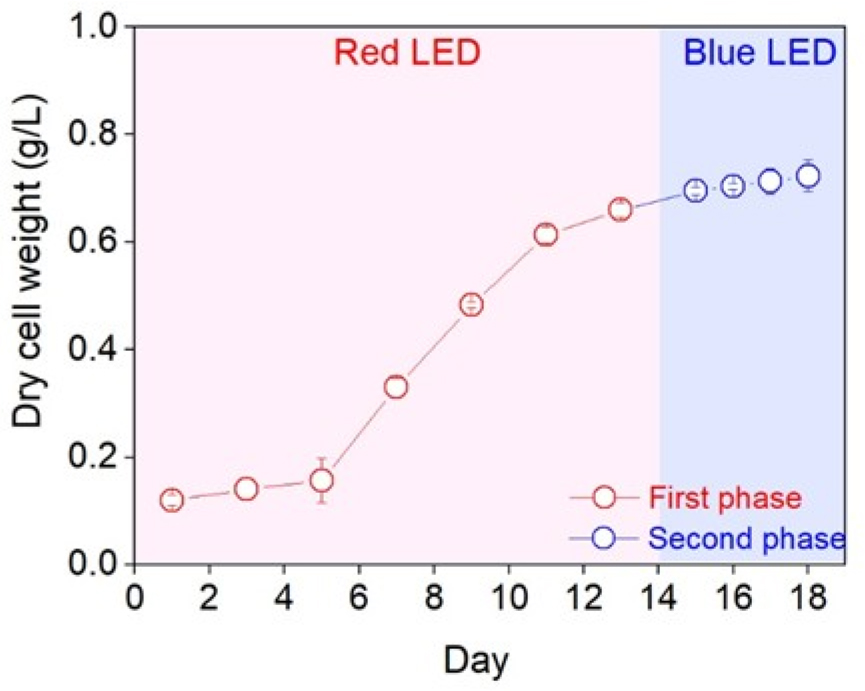
Fig. 1
Variations in dry cell weight (g L–1) during the two-phase cultures of Chlorella vulgaris PKVL 7422. Cultures were incubated at 20°C under a light intensity of 100 μmol m–2 s–1 with a 12L:12D pho-toperiod, using red LED light during the first phase and blue LED light during the second phase. Data are presented as mean±standard deviation (n=3).
Regarding biological composition, the carbohydrate content on day 11 (first phase, under red LED) was 130.5±13.20 µg g–1. During the second phase (under blue LED), carbohydrate levels ranged from 109.0±1.11 to 142.6±2.84 µg g–1 between days 15 and 18, and no statistically significant differences were observed compared to the first phase (p<0.05; Fig. 2). However, the protein content was 334.5±2.91 µg g–1 on day 11 and increased steadily under blue LED light during the second phase, reaching 512.5±14.04 µg g–1 on day 17. This represented a statistically significant increase (p<0.05), with the peak value approximately 1.5 times higher than that in the first phase (Fig. 2). Similarly, lipid content was 457.4±0.03 µg g–1 on day 11 and increased continuously during the second phase, peaking at 715.2±24.14 µg g–1 on day 17. This corresponded to an approximately 1.6-fold increase compared to that in the first phase and was statistically significant (p<0.05; Fig. 2), suggesting increased biosynthesis of lipids during the stationary phase under blue light.
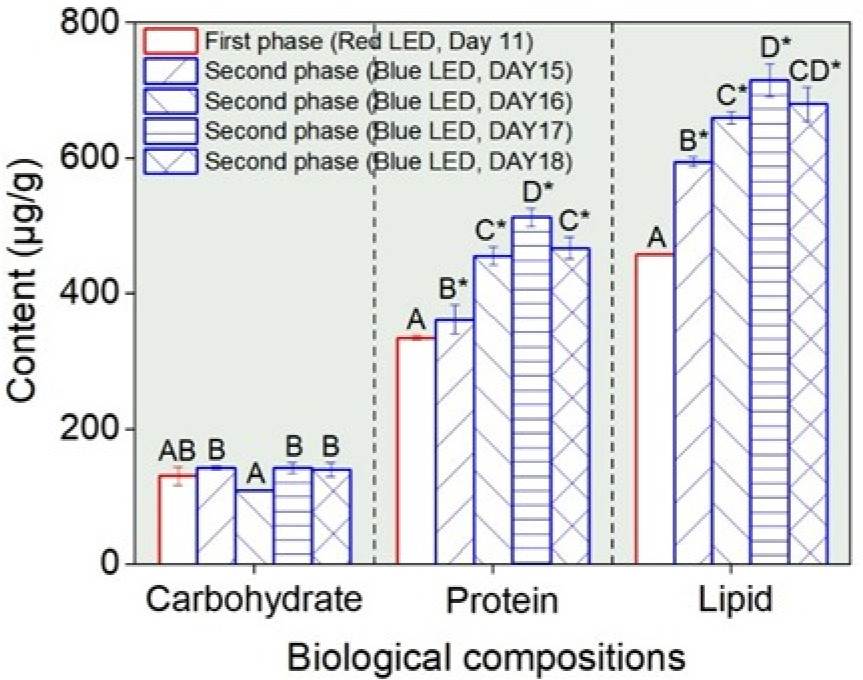
Fig. 2
Biochemical compositions of Chlorella vulgaris PKVL 7422 during the two-phase light culture. Measurements were conducted on cells harvested on day 11, corresponding to the late exponential phase of the first phase, and daily from day 15 to day 18, corresponding to the stationary phase of the second phase. See Fig. 1 for incubation conditions and data presentation. Different capital letters indicate significant differences between treatments (p<0.05, Duncan’s multiple range test). The asterisk symbol (*) indicates a significant difference between the first and second phases.
3.2 Growth and biochemical composition under MLC for C. vulgaris
The maximum dry weight was comparable under the 7r:3b ratio, which had a higher proportion of red light (0.71±0.01 µg g–1), and the 3r:7b ratio (0.70±0.01 µg g–1), which had a higher proportion of blue light. In contrast, the lowest dry weight was observed under the 5r:5b ratio (0.58±0.03 µg g–1) (Fig. 3). The highest growth rate was recorded at 0.49 day–1 under the 7r:3b ratio, while the lowest was 0.41 day–1 under the 3r:7b ratio (Fig. 3).
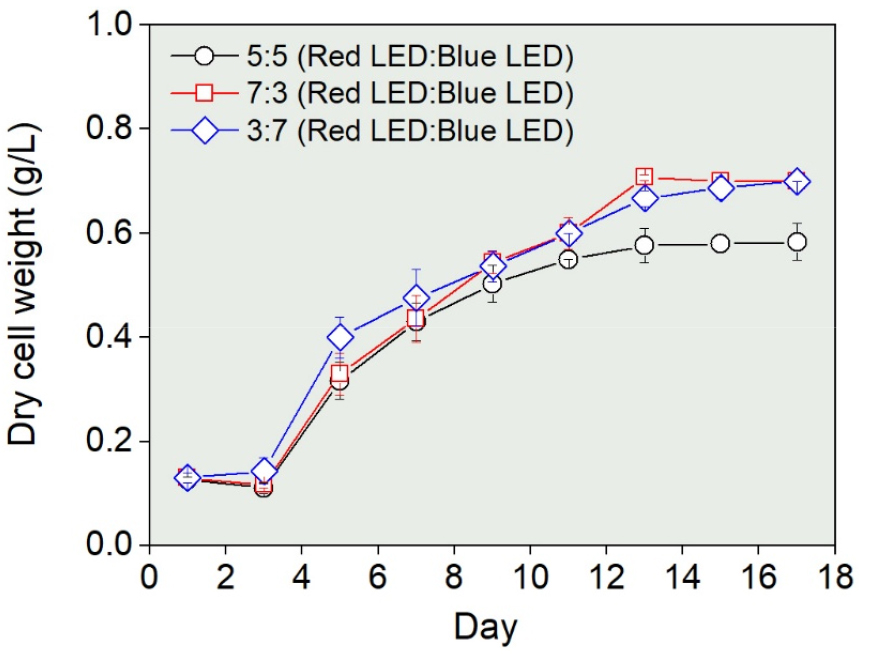
Fig. 3
Variations in dry cell weight (g L–1) of Chlorella vulgaris PKVL 7422 under mixed LED wavelengths with red: blue LED ratios of 5:5, 7:3, and 3:7. Cultures were incubated at 20°C with a light intensity of 100 μmol m–2 s–1 (combined intensity from red: blue LEDs). See Fig. 1 for data presentation.
Except for carbohydrates, both proteins and lipids showed higher concentrations during the stationary phase than during the exponential growth phase, as observed in a previous experiment (Fig. 4). In carbohydrates, the 3r:7b ratio showed 119.1±6.77 µg g–1 in the exponential growth phase and 117.0±14.56 µg g–1 in the stationary phase, which were higher than those of the other ratios (p & 0.05; Fig. 4). Similar to the trend observed for carbohydrates, protein content was also relatively higher under the 3r:7b ratio, with concentrations of 692.2±51.9 µg g–1 in the exponential phase and 842.3±7.48 µg g–1 in the stationary phase, compared to the 7r:3b ratio (p<0.05). Notably, the protein content in the stationary phase under the 3r:7b ratio was approximately 1.7 times higher than that observed on day 17 in the TPLC, which had previously shown elevated levels (Fig. 2). Similarly, the stationary phase under 5r:5b conditions also exhibited a protein content approximately 1.6 times higher than that on day 17 (Fig. 2). Lipid content was also significantly higher under the 3r:7b ratio, with concentrations of 500.5±5.68 µg g–1 in the exponential phase and 690.6±13.55 µg g–1 in the stationary phase, compared to the other ratios (p<0.05), showing a level comparable to that measured on day 17 in the TPLC (Fig. 2). These results indicate that the 3r:7b ratio could synthesize more biochemical components than the other ratios.
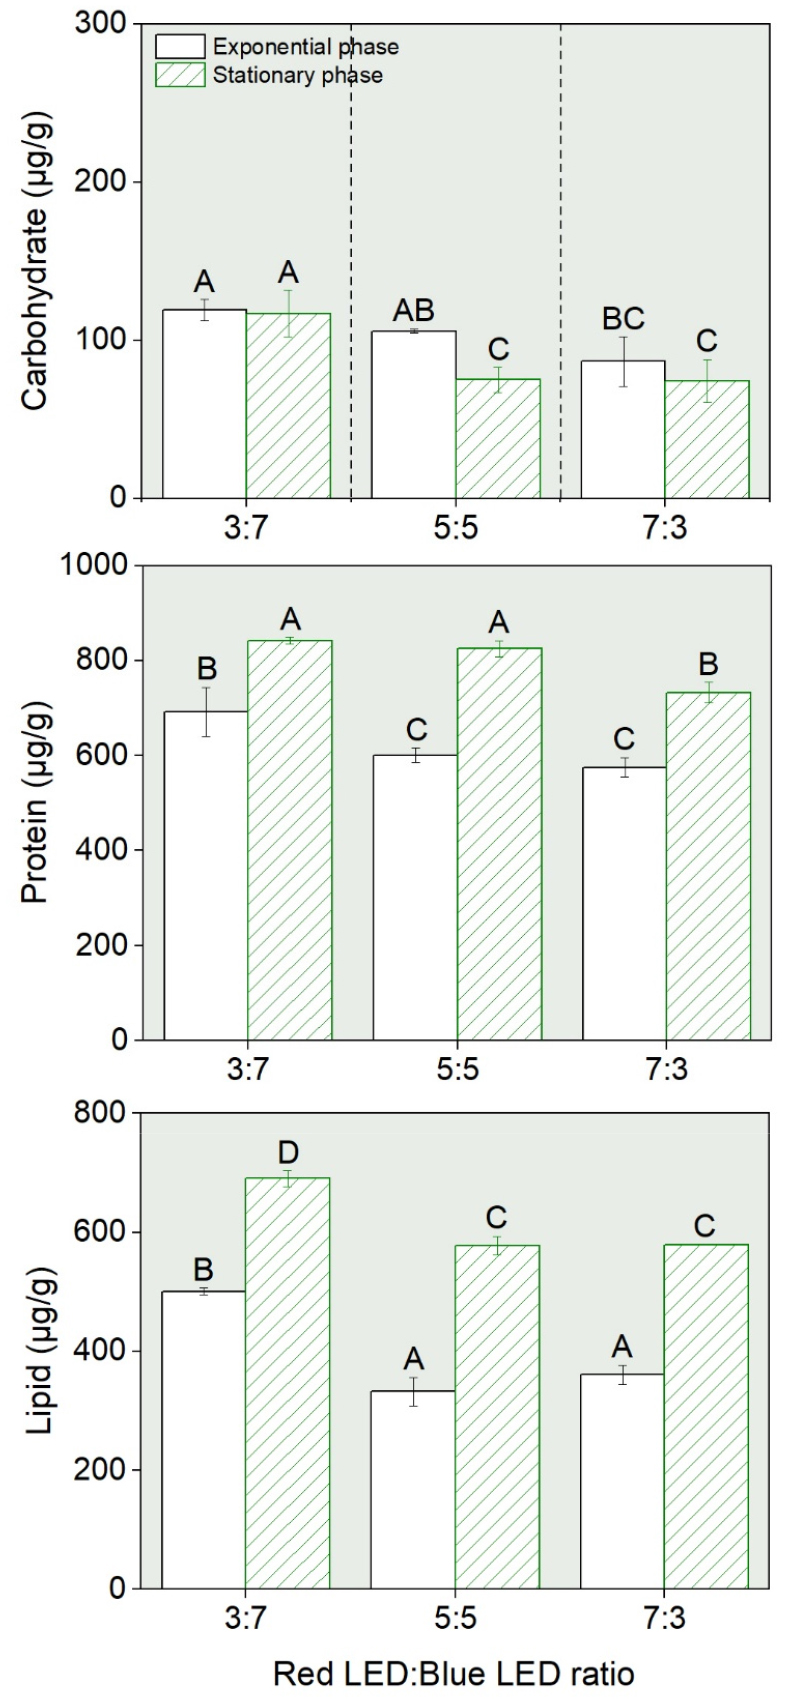
Fig. 4
Biochemical compositions in Chlorella vulgaris PKVL 7422 cultured under different red LED: blue LED ratios (3:7, 5:5, and 7:3). Measurements were conducted on cells harvested at the middle exponential and stationary phases. Different capital letters indicate significant differences between treatments (p<0.05, Duncan’s multiple range test).
4. Discussion
C. vulgaris exhibits a high growth rate and strong light affinity under red light. Han et al. (2023), who conducted experiments effects of single LED wavelengths on the growth and biological compositions using the same strain as in this study, reported that the lowest compensation photon flux densities (I₀) were observed under blue (15.90 μmol m–2 s–1) and red (11.26 μmol m–2 s–1) wavelengths, followed by green light (21.23 μmol m–2 s–1) and fluorescent lamps (21.92 μmol m–2 s–1). However, the half-saturation constant (Ks), an indicator of light affinity, was approximately three times lower under red light (47.08 μmol m–2 s–1) compared to blue light (137.6 μmol m–2 s–1). Several studies have reported that other C. vulgaris strains exhibit higher cell densities under red light than under other wavelengths (Yan et al. 2013; Khalili et al. 2015; Habibi and Sibi 2019). Among other green algae, C. pyrenoidosa and Haematococcus pluvialis exhibit enhanced growth under red light (Lee and Palsson 1994; Katsuda et al. 2004). Similarly, Arthrospira platensis (formerly Spirulina platensis) and Synechococcus spp. show comparable growth responses under red light (Takano et al. 1995; Tian et al. 2018). In addition, red light enhances photosystem II activity in the red alga Porphyridium cruentum more than three times compared with green light (Cunningham et al. 1990). The high light affinity of C. vulgaris under red light was attributed not only to chlorophyll-a (Chl-a) but also to chlorophyll-b (Chl-b), an accessory pigment present in green algae. Chl-b showed absorption peaks at 455 nm and 642 nm, allowing it to absorb both blue and red light and transfer energy to the reaction center in the photosystem. The red light employed in this study had a peak wavelength of 660 nm, which is closely aligned with the red absorption band of Chl-b, thereby facilitating efficient light capture and energy transfer. In addition, Chlorella contains higher levels of Chl-a and Chl-b than other microalgae (Oo et al. 2017).
Several studies have described the efficiency of the accumulation of biological compounds using TPLC. This culture is based on integrating growth-stimulating and stress-inducing factors, such as light wavelengths, temperature shifts, and chemical additives (for example, NaCl), to enhance the production of biological compounds (Sun et al. 2018). C. vulgaris and Nannochloropsis sp. exhibited enhanced production efficiency when blue or red light was applied during the initial phase for biomass production, followed by green light in the second phase for accumulating valuable compounds (Ra et al. 2018; Kim et al. 2019). Furthermore, Sirisuk et al. (2018) reported that N. salina and Phaeodactylum tricornutum exhibited the highest lipid accumulation rates in TPLC, where red light was applied until the late exponential phase, followed by green light continuing into the stationary phase.
The C. vulgaris PKVL7422 strain used in this study produces lower levels of biological components, such as proteins and lipids, under green light than under blue light (Han et al. 2023). Several studies have reported enhanced production of biological compounds under blue light. At 705 nm, photosystem I (PSI) is activated because of the diminished absorption efficiency of photosystem II (PSII) at longer wavelengths. In contrast, at wavelengths below 650 nm, both PSI and PSII are actively engaged as these shorter wavelengths are efficiently absorbed by the respective reaction centers of both photosystems (Schreiber et al. 2012). Therefore, efficient photosynthesis can occur under blue light (450–500 nm), as it effectively excites both photosystems. Blue light stimulates the transcription of photosynthesis-related genes and activates enzymes, thereby enhancing the accumulation of biologically valuable compounds (Ruyters 1984). C. vulgaris, C. ellipsoidea, and S. obliquus exhibited high carbohydrate, protein, and lipid contents under blue light (Habibi and Sibi 2019; Baidya et al. 2021). However, Guo and Fang (2020) observed that C. pyrenoidosa achieved high cell density under blue light, whereas its protein content was the lowest under the same condition. Similarly, Taufikurahman and Shafira (2019) reported that the protein contents of C. vulgaris and C. pyrenoidosa showed no significant variation across different light wavelengths. In contrast, the C. vulgaris strains examined by Kendirlioglu and Cetin (2017) exhibited higher growth rates and protein content under red light. These results suggest that even within green algae, different species or strains exhibit different responses to light wavelengths, highlighting the importance of evaluating light-specific responses among different strains.
Using the same C. vulgaris strain, Han et al. (2023) reported that carbohydrate content was not significantly affected by monochromatic light during the exponential and stationary phases, as observed in our study. Protein and lipid contents were higher under blue light (713 µg g–1) than under red light (577 µg g–1) in the stationary phase (Han et al. 2023). Notably, the contents under blue light were similar to those observed in the second phase of TPLC in our study. Although the effectiveness of TPLC based on light wavelength has been proposed in many studies, our TPLC system was not effective in enhancing the production of biological compounds in this strain. Therefore, to improve the performance, we conducted additional experiments using an alternative MLC system combining both red and blue light.
In this study, the MLC using red and blue light resulted in high protein and lipid contents. Notably, under the 3r:7b ratio, lipid content was comparable to that obtained under the TPLC, while protein content exceeded that observed under TPLC conditions. C. vulgaris 2714 strain exhibited the highest lipid productivity under a 1r:2b ratio at a light intensity of 85 μmol m–2 s–1 (Ren et al. 2022). According to Cai et al. (2023), a 1r:4b ratio at light intensity of 150 μmol m–2 s–1 resulted in the most rapid synthesis of C. vulgaris biomass, along with increased production of total lipids and amino acids. Similarly, Gau and Fang (Guo and Fang 2020) reported that an 8r:3b ratio enhanced protein and total lipid contents in C. pyrenoidosa compared to both monochromatic blue light and an 8r:1b ratio. In contrast, C. pyrenoidosa cultured under a 3r:7g light ratio at an intensity of 150 μmol m–2 s–1, where green light was substituted for blue, exhibited no significant difference in growth compared to the 7r:3g ratio. However, the proportion of unsaturated fatty acids was significantly elevated only under the 7r:3g ratio (Chu et al. 2021). In cyanobacterium A. platensis, MLC resulted in a higher protein content than white LED, with the highest levels observed at 1r:6b and 1r:8b ratios. In contrast, mixed LED ratios had no significant effect on lipid accumulation in the green alga Nannochloropsis salina, whereas the diatom P. tricornutum exhibited higher lipid content under conditions with a higher proportion of blue LED light (Sirisuk et al. 2018). In H. pluvialis, the synthesis of carotenoids, such as astaxanthin, was higher under a 2r:1d ratio, which has a relatively higher proportion of blue light, compared to monochromatic red light or a 6r:1d ratio, because of the higher efficiency of astaxanthin synthesis under blue light than under red light (Li et al. 2020). Najafabadi and Naeimpoor (2023) promoted the accumulation of biological compounds in D. salina by combining TPLC and MLC. In their study, cells were initially cultured under a 6r:4b ratio during the first stage. In the second stage, exposure to blue light significantly enhanced intracellular protein and lipid contents, whereas red light resulted in a higher biomass concentration. Based on these findings, for C. vulgaris PKVL7422, culturing under 3r:7b conditions during the first phase, followed by exposure to blue light in the second phase, may be more effective in enhancing the accumulation of valuable biological compounds.
MLC treatments have been adopted as an effective strategy for utilizing specific light wavelengths to remove eutrophic nutrients. Chlorella sp. isolated from China showed more effective growth under mixed LED wavelengths than under monochrome LED, and the 7r:3b and 5r:5b ratios were identified as the most suitable mixed wavelengths for biogas upgrading (Yan and Zheng 2014). Nitrogen removal by S. obliquus in a photobioreactor bag was significantly higher under the 7r:3b ratio than the other ratios (Zhao et al. 2015). In addition, Kim et al. (2013) reported that nitrogen and phosphorus removal rates were higher with the 7r:3b ratio than with the 5r:5b ratio. Thus, nutrient removal in waste treatment has often been more efficient under either a high proportion of red light or a balanced 1r:1b ratio. This is likely due to the particularly high nutrient removal capacity of red wavelengths in green microalgae. In general, nutrient removal from the effluent was significantly correlated with dry weight, which is an indicator of cell density (Singh and Dhar 2007). This relationship was explained by the Monod equation (Monod 1949), which describes the dependence of microbial growth rate on nutrient concentration, and the Michaelis–Menten equation (Johnson and Goody 2011), which illustrates the relationship between nutrient uptake rate and substrate concentration. At low nutrient concentrations, both models predicted a near-linear relationship between nutrient availability and cellular activity. In an experimental study using C. vulgaris for nutrient removal from wastewater, red LED illumination resulted in the highest growth rate and cell density. Moreover, the removal efficiency under red light was significantly higher than that observed under white (broad-spectrum) light (Ge et al. 2013). Therefore, mixed LED light with a higher red-light ratio may be more effective for enhancing pollutant removal through increased cell density rather than solely enhancing the biological composition of green algae, such as C. vulgaris.
Chlorella comprises over 100 species, with substantial physiological and biochemical variations documented even at the species level. Intraspecific differences among strains have been reported in amino acid compositions, lipid profiles, photosynthetic pigments, and mineral concentrations (Bock et al. 2011; Maurício et al. 2023; Safafar et al. 2016). Our study demonstrated that the MLC system enhanced the biological composition (particularly protein content) of C. vulgaris PKVL7422 strain more effectively than monochrome LED or TPLC systems. Although the species investigated in this study have been extensively studied for decades, studies on the effects of MLC on the enhancement of its biological compositions remain limited. Recent studies have attempted to apply adaptive laboratory evolution for the industrial utilization of microalgae. Fu et al. (2013) reported that light stress induces phenotypic alterations or the selection of mutants in D. salina, leading to the development of strains with enhanced tolerance to photoinhibition. These findings suggest that the initial physiological responses of microalgae may vary depending on culture conditions. Therefore, in future studies, examining the changes in the biological composition over the course of incubation is essential, as the cellular physiology of C. vulgaris PKVL7422 may also change during prolonged cultivation. Furthermore, exploring the effects of factors, such as nutritional stress and heterotrophic culture, may help enhance the efficient and high-quality production of lipids and proteins by this strain.
